SAGE Automation, Published: October 4, 2018 - Updated: February 25, 2020 (6 min read)
Our previous blog explored how to improve industrial energy efficiency through power factor correction and load shifting. This blog will address an equally important part of any energy management program – measuring and analysing energy consumption.
Basic measurement
The first step in any energy management activity should be to understand the current state. Clearly understanding how the plant consumes its energy should help calculate an indicative return-on-investment on any improvement activities that you suggest.
Start with the basics: contact your energy retailer and request a usage history.
Then:
1. Examine the data over time, including seasonal and peak consumption
2. Examine your plant installations by looking at your specific loads, and if:
a) Ratio of non-linear vs linear loads is low – an energy audit not recommended
b) Ratio of non-linear vs linear loads is high – an energy audit may be recommended. SAGE Automation can perform this.
3. Calculate compensation equipment requirements and expected reduction in energy usage after compensation.
It will also pay to question current business processes and employee behaviour in relation to this usage data.
Smart metering
A basic utility report will only provide a high level summary of usage. Smart meters and sub metering allow you to drill down when, where and what is consuming electricity:
Smart meters
Smart meters digitally measure the facility’s power consumption every 30 minutes, rather than waiting for manual meter inspections. They can also allow utilities to report on power quality in real-time.
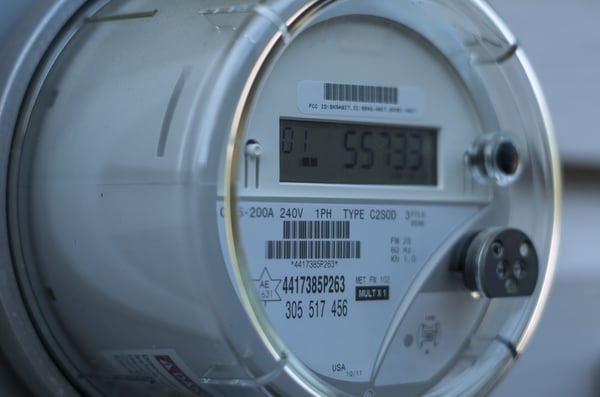
Smart meters report energy use in real-time. Image: Utilitymag.com
Sub-meters
Sub-meters can measure energy usage of separate sub-systems on a site such as pumps, conveyors, fans, lifts, lighting, heating and cooling, and plug loads. This is especially useful for understanding if certain appliances or systems are using more energy than others.
In short: Smart metering can provide data for demand response activities such as load shifting/peak shaving, while sub-metering identifies which appliances, machines or systems are drawing more energy than others.
Well suited to: Any complex business with multiple processes, appliances and systems. Any breakdown of energy usage should lead into improvement programs that are supported by management.
Data visualisation and analytics platforms
If you’re going to gain any real insights into energy efficiency, you need to have a way to visualise, interpret and present the data. There are two ‘levels’ of sophistication here:
- Data visualisation & monitoring platforms present data on a dynamic dashboard that allows for data manipulation and customisation. Grafana is one such open source platform.
- Deep data analysis and machine learning software enables you to scrutinise the data beyond this, and will undertake complex problem solving. Software such as Seeq is a powerful option. See how it worked for TasWater’s blockage detection model.
e.g. 'Level 1' energy efficiency monitoring:
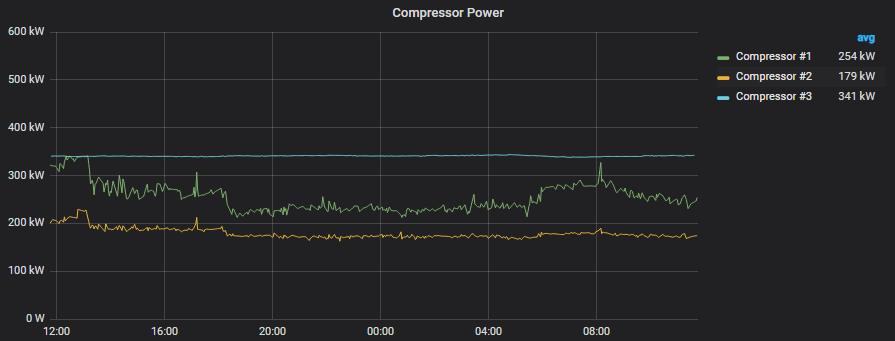
Our sister company Nukon is helping a manufacturer monitor its energy efficiency for key systems such as its air compressors and cooling fans. Grafana dashboard provides the data visualization of an Influx time-series database. Each compressor is outfitted with a current sensor which feeds current data into the time-series database via Citect SCADA. The manufacturer plans to roll out a second platform for deeper analysis.
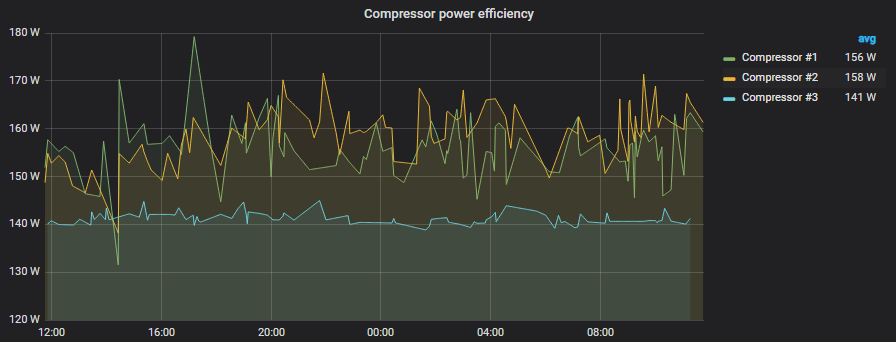
Power consumption for each compressor is calculated from the measured current as sqrt(3) * voltage * current * power factor:
Flowrate at each compressor output is measured by flow meters and recorded in a time-series database via Citect SCADA:
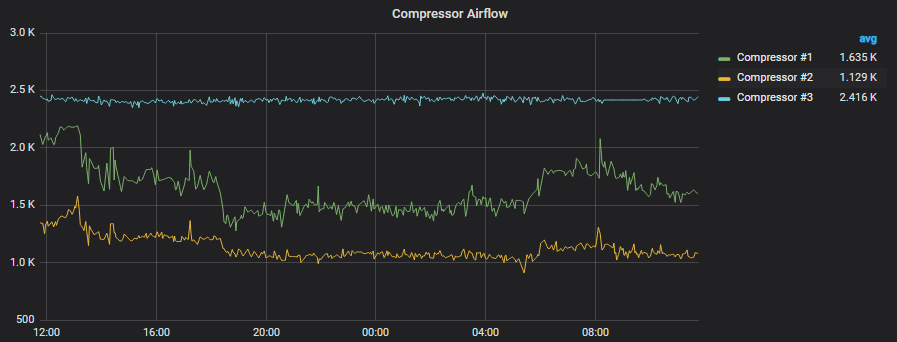
With the above values you can calculate kW used per unit of airflow and compare efficiencies of various compressors throughout a shift:
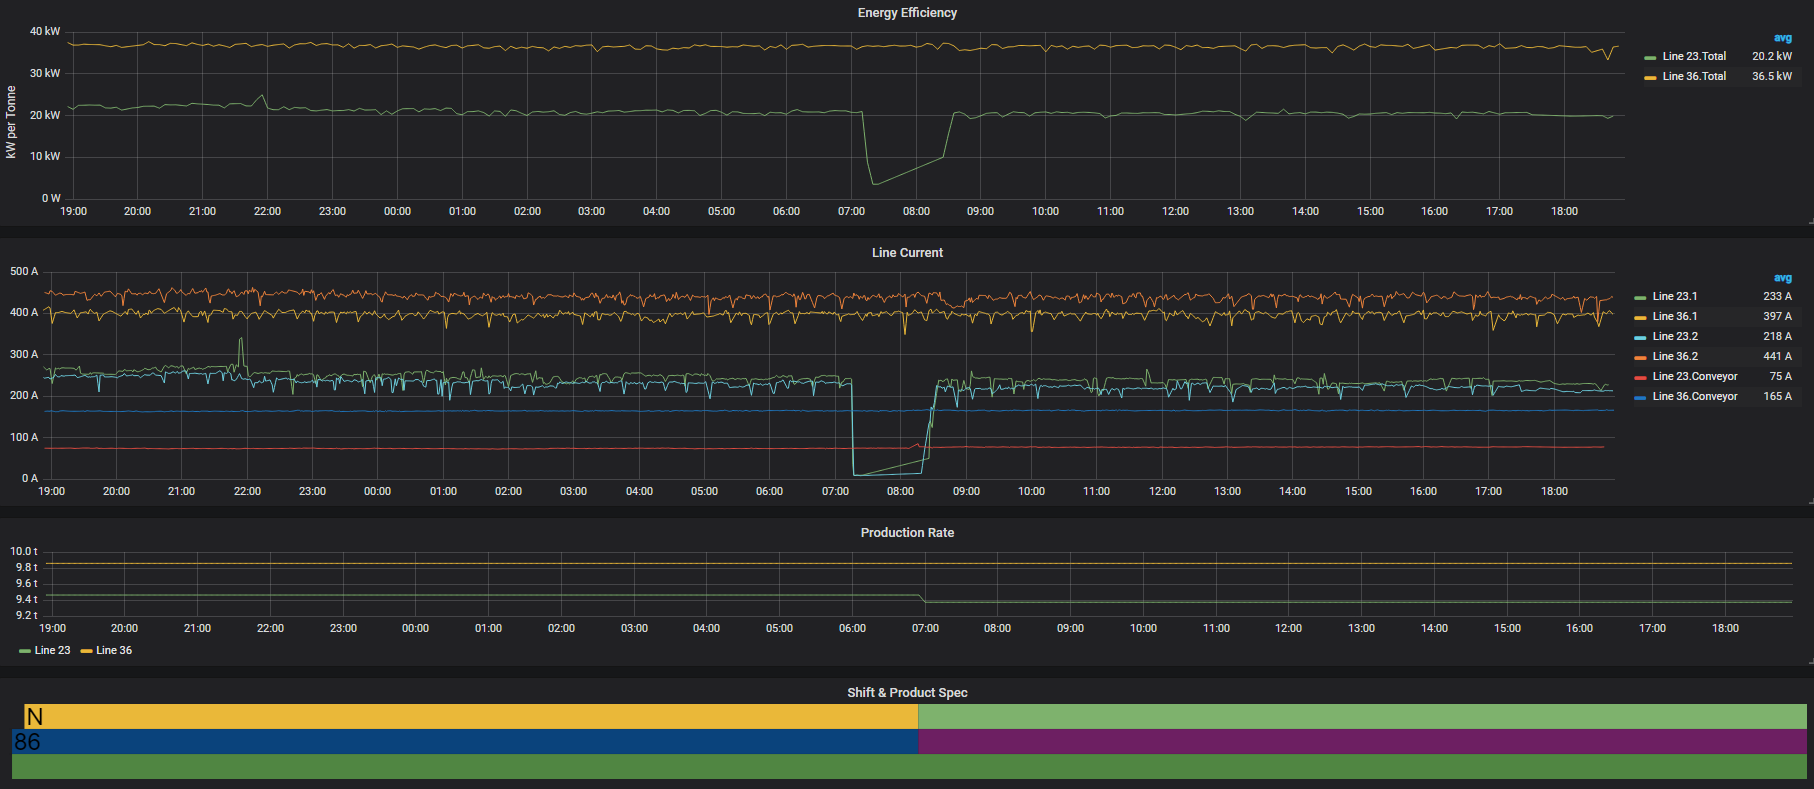
A number of other data sets and systems can be scrutinised such as energy used per product, grouped by shift and product:
In short: Data visualisation platforms and/or deeper analysis software can identify energy efficiency and consumption patterns, and provide direction and measurement data for improvement programs.
Well suited to: A 'Level 1' type platform is ideal for those who are just starting to gather baseline data and are unsure exactly what they wish to achieve with an energy monitoring program. You'd want to have a clear plan and know what analytics you need, in order to make full use of a 'Level 2' analytics platform.
Getting started: optimising energy efficiency
Improving energy efficiency should always start with getting the data on your consumption – both at the high level, and drilling down to your systems and individual machines.
Understanding exactly how and when the facility consumes its energy should help calculate an indicative return-on-investment on any improvement activities that you suggest.
In case you missed it, read Part 1 of this blog series: Technologies that improve industrial energy efficiency: power quality
Explore more: our free guide to managing industrial energy costs explores the energy market and current technologies that are giving heavy energy users saving opportunities. The guide covers: What energy challenges are big businesses facing?, Energy Management & Measurement, Making financial savings through improved energy efficiency, Distributed Energy Resources and Industry 4.0 Enhancements.
Download your free copy today: The graphical guide to managing industrial energy costs [with renewables and Industry 4.0]