Ashby Martin, Published: February 28, 2019 - Updated: February 25, 2020 (5 min read)
Smart Cities has a wide range of definitions across the industry with lots of promises being made on technology that can achieve ambitious outcomes. At SAGE we have a simple and concise vision on what Smart Cities is:
Smart Cities is the optimisation of city resource allocation through data, which allows reactive processes to become predictive.
But what does this mean in practice and how do we achieve this predictive nirvana? Most organisations undergo this transformation in three stages:
Stage 1: Reactive resource use
This stage uses excess resources, energy and expenditure to achieve an outcome.
In this stage, there are often personnel or equipment on standby, waiting to respond to an incident or situation. This stage also represents a planning approach where far more facilities are built than required because there is uncertainty around the actual number of visitors in an area.
Waste management – Bins are emptied on a schedule whether they are full and overflowing, or empty.
Urban planning – A new area is built with excess spare car parks, seats or bathrooms because it is not known how many people visit the area.
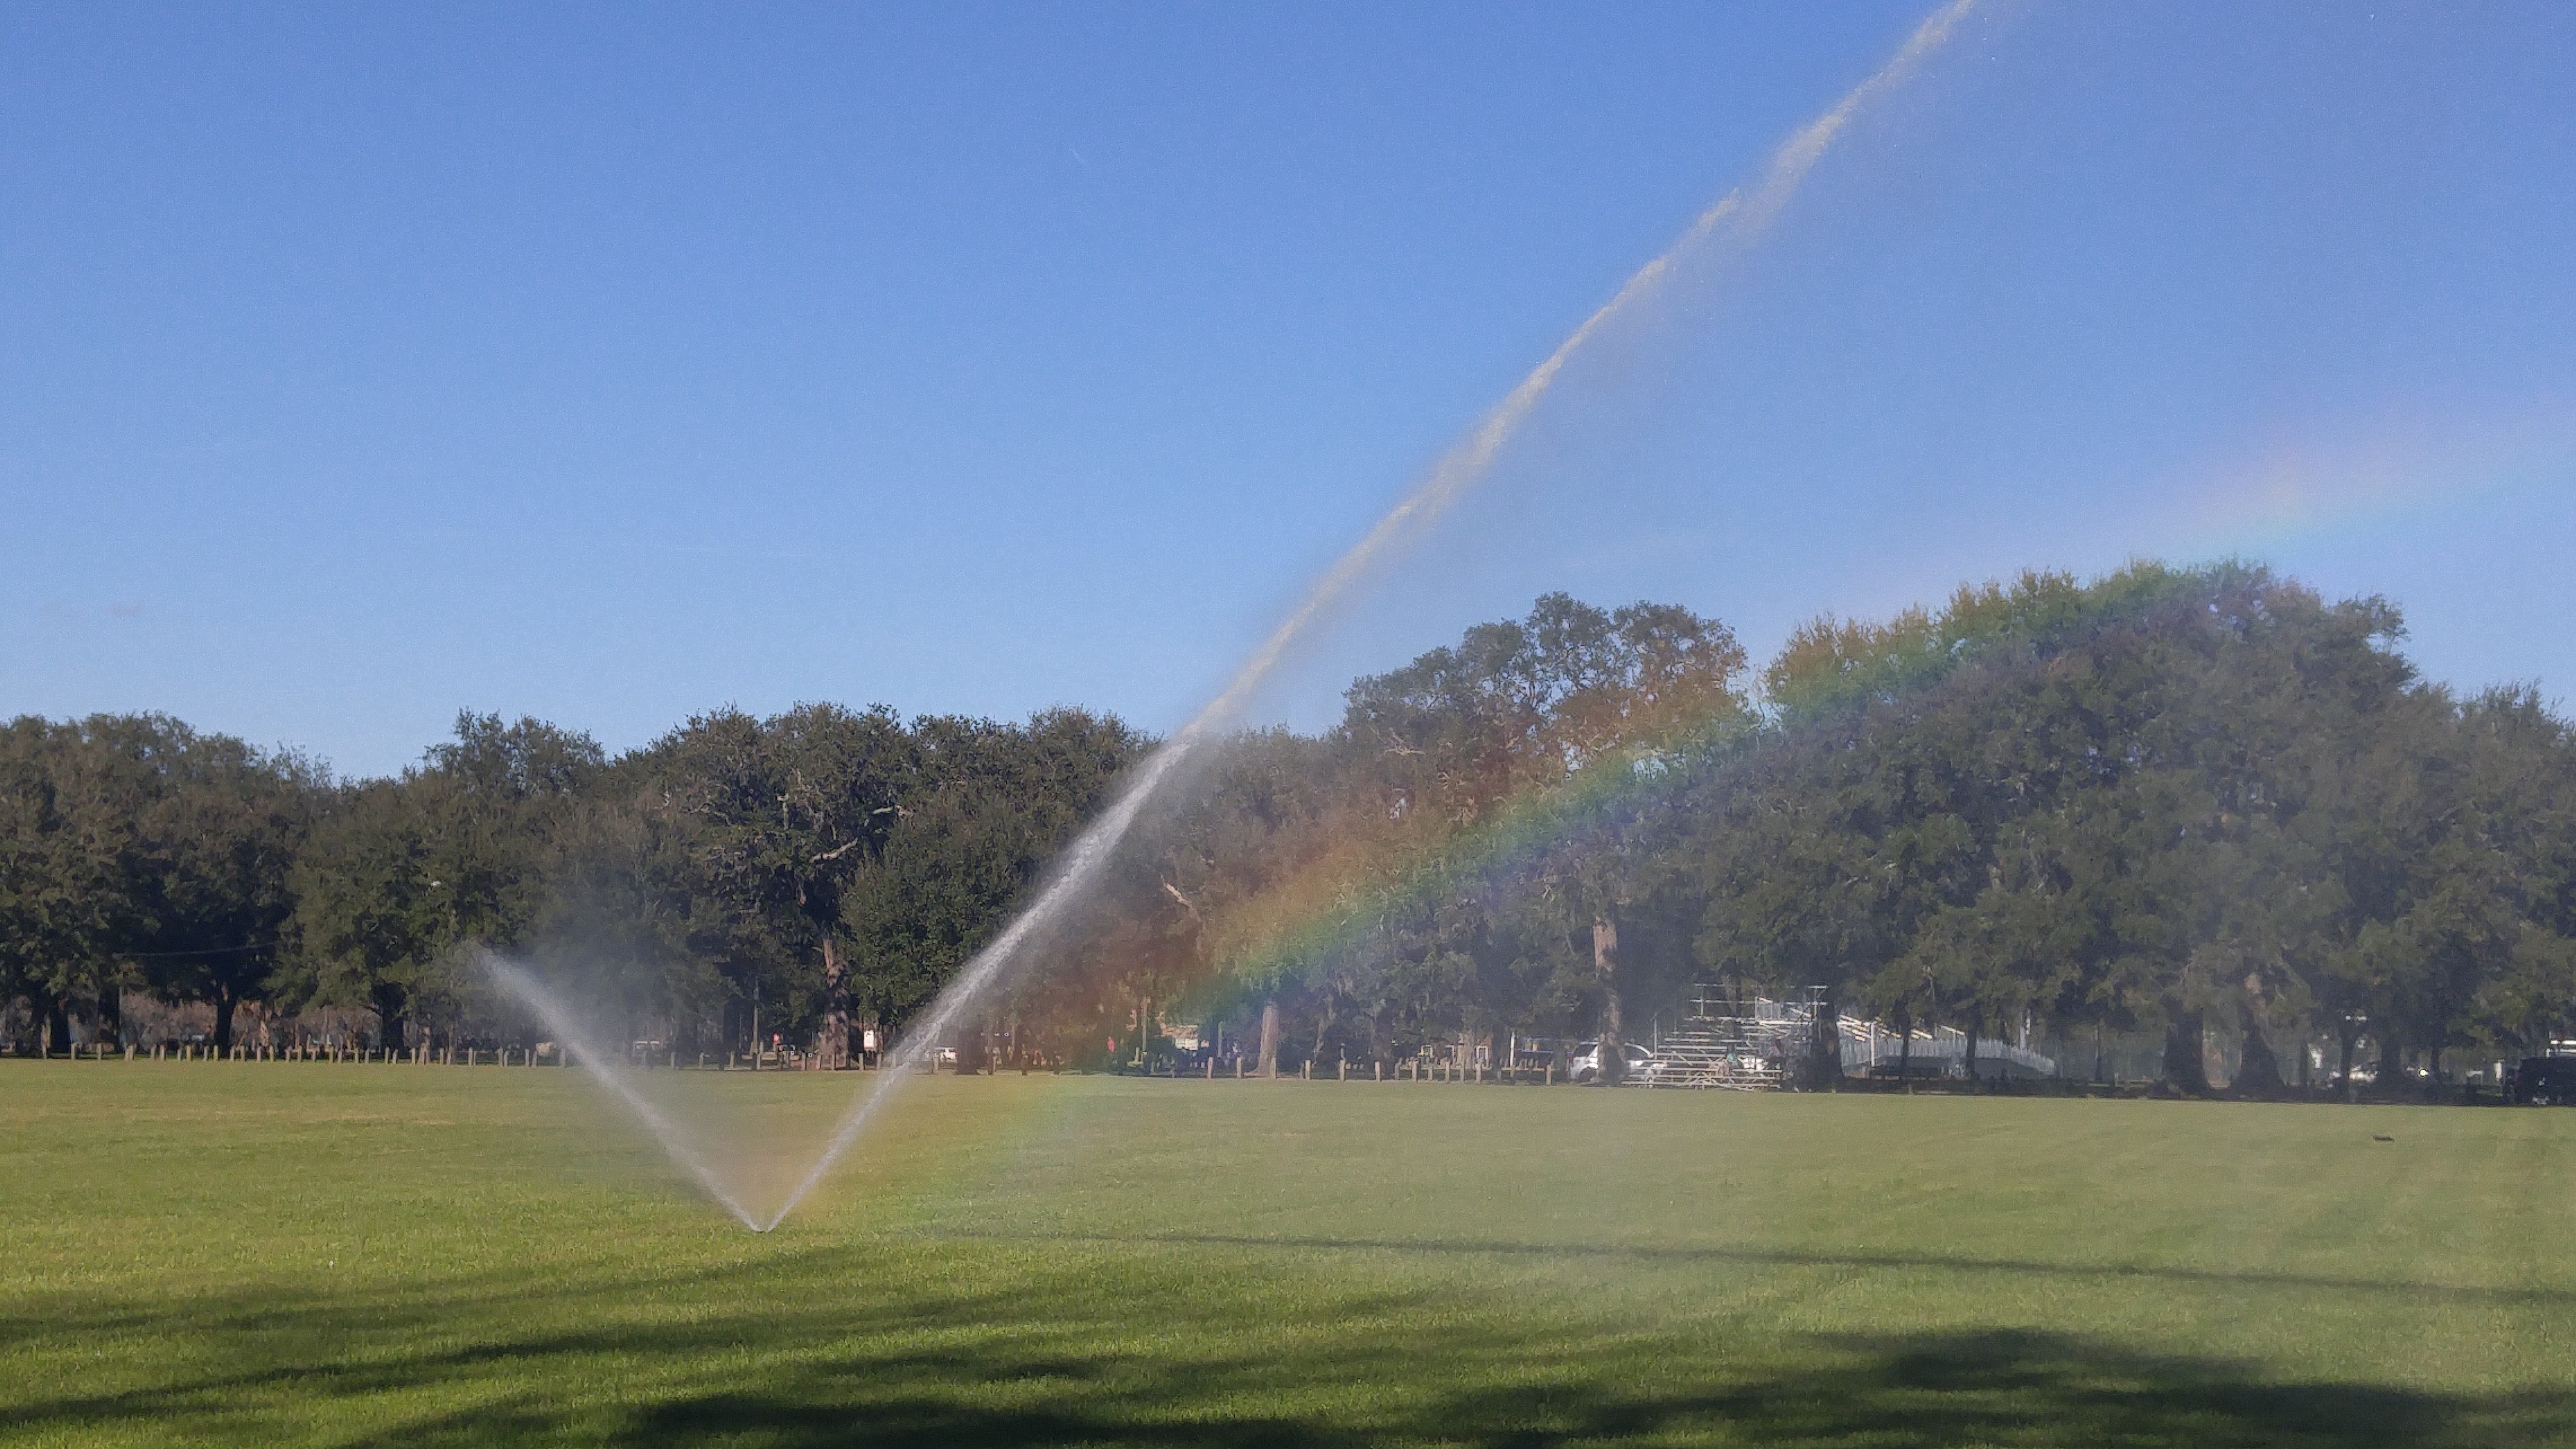
Irrigation – An oval is watered on a fixed schedule, regardless of the environmental conditions.
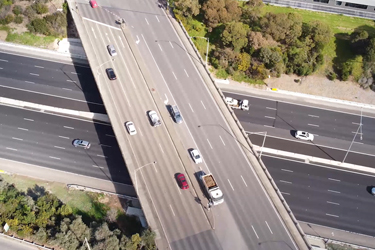
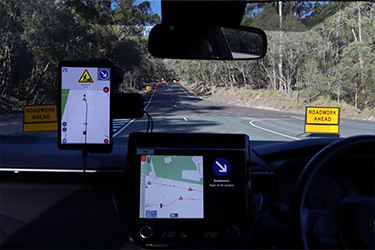
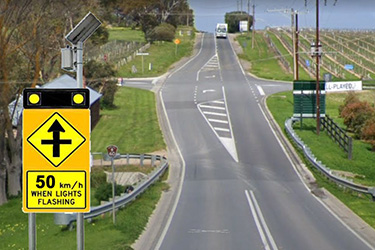
Transport – The road network is planned using historical road counts taken over one day from the last 10 years and delays are expected when travelling from one place to another.
Stage 2: Proactive resource use
This stage leverages data to support the use and provision of resources.
In this stage there is a reduction in faults, congestion and delays. Resources are more efficiently allocated, meaning that there are lower capital costs in planning and less ongoing expenditure for maintenance and support.
Waste management – Bins are emptied when they reach a threshold level or the appropriate schedule is calculated based on historical trends.
Urban planning – Pedestrian movement counts indicate that there are 150 visitors per hour and they stay for an average of 45 minutes, requiring two sets of amenities. Car parks in surrounding areas are measured to be underutilised so a reduced number of new car parks are required, resulting in more space for public art.
Irrigation – The oval is watered when the soil moisture is low or when measured enviro-transpiration indicates that the ground is dry. This results in reduced water usage and better environmental outcomes.
Transport – Real-time congestion is known and delays can be managed. The road network can be planned around the management of peak periods which consider time of day, special events and school periods.
Stage 3: Predictive resource use
This is the optimal state in which exactly the required amount of resources are used and no more.
This is an ideal state which organisations should strive to achieve. This stage will draw upon historical data, the current state of the system and use this to guide a course of action which achieves the task at the correct time.
Waste management – Bins are emptied as they become full, the collection route is optimised to ensure the shortest route is taken to empty the fullest bins. Public events are anticipated and bins are emptied prior to surge periods.
Urban planning – The number of pedestrians is projected into the future based on accurate historical trends and rates of growth. Parking locations are dynamically made available as required, allowing shared use areas for pedestrians only when parking demand is low.
Irrigation – The oval is watered in anticipation of a hot day during a time when the wind is low. The appropriate amount of water is used to suit the soil, grass type and foot traffic.
The challenge of meeting the predictive state seems daunting, but through a process of gathering applicable data and integration of business rules, the optimal state can be practically achieved. Here are some practical ways to move towards an optimised state:
- Identify areas of key resource usage such as energy, water, money and collect data around those areas. Install a wide area network which enables the use of low-power sensors to collect data points with low cost and maintenance.
- Display collected data in a clear way which allows fast identification of trends and identification of abnormalities. Contextualise the data to provide situational awareness.
- Create business rules to trigger actions when thresholds are met. Simple emails which are sent when a tank gets too full or when a door has been opened a number of times can be useful in beginning an efficient response to a set of conditions.
- Automate processes to replace repetitive or predictable responses. It’s not necessary to email someone to order a bag of bolts if the order can be automatically sent when inventory drops below a certain level.
- Measure the improvements and make small iterative changes. Record data around what works and what doesn’t, feed this back into the collected data to understand where the best value for money was found.
It might be difficult to see your city truly reaching the fully optimised state, but it is possible. Through a smart approach with the support of data, the practical steps to eliminating waste will result in a measurably better use of resources.
SAGE can help with all stages of this transition, from collecting and aggregating data to implementing useful business rules. Any improvement in how resources are allocated is undoubtedly linked to an increase in community liveability.
If you’re interesting in learning more, read our article on IoT projects that we’ve delivered: